

Grow With It: Personalisation Strategy & Behavioural Insights
The Challenge
- Assumption:
- Participants of Grow With It weren’t engaging with the resources page, possibly because the content didn’t appear relevant or appealing at first glance.
- Hypothesis:
- Displaying thumbnail images tailored to audience type would encourage more clicks on resources (focusing on the ‘Get started’ section of the page).
My Role
I led the analysis and optimisation strategy, using:
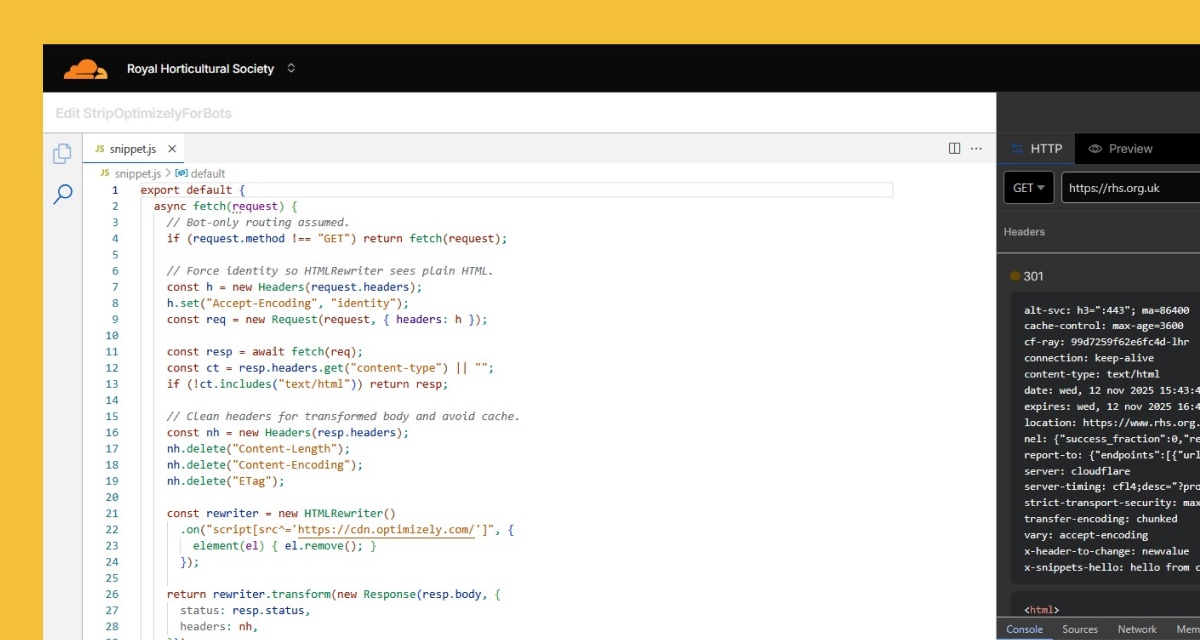
- Optimizely for personalisation based on UTM parameters
- DotDigital for segmented email targeting
- Contentsquare and Google Analytics for behavioural insights and performance tracking
Tools & Setup
- Optimizely: Delivered personalised content based on UTM parameters.
- DotDigital: Segmented email campaign by audience type.
- Contentsquare: Pre-defined zones and events for scroll, hover, and journey tracking.
- Google Analytics: Tracked landing page behaviour and UTM performance.
What We Tested
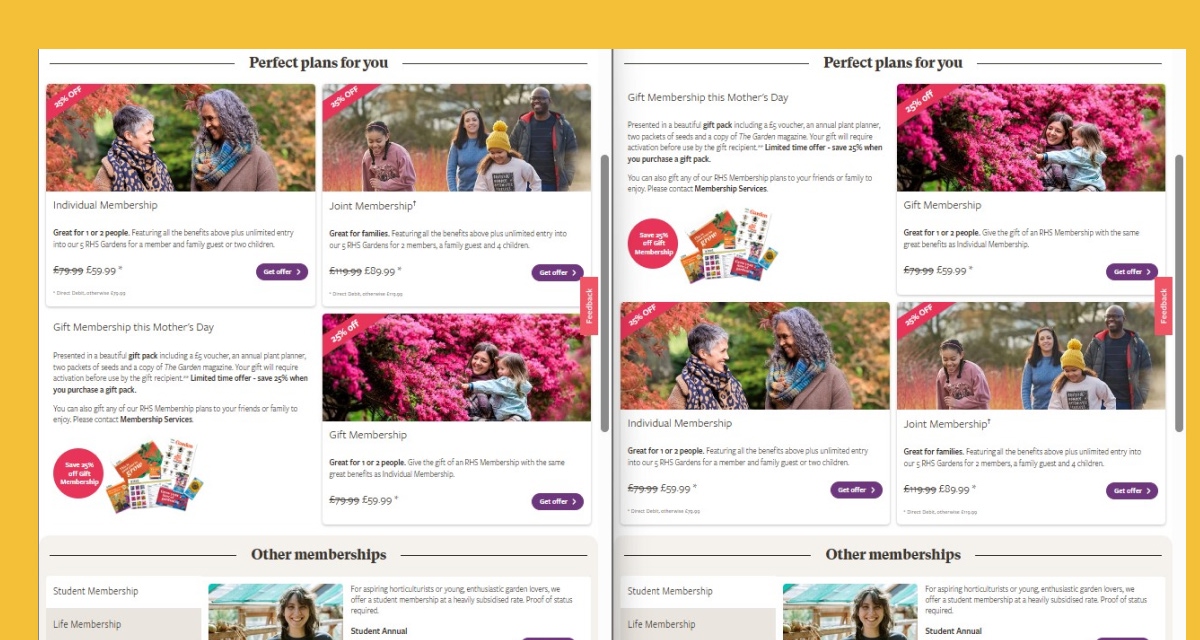
We personalised the “Growing in Small Spaces” page with tailored thumbnails and reordered content based on user type (e.g., Families, Individuals). The goal was to increase engagement with the “Get Started” section.
Families and Schools Image personalisation

Community group Image personalisation

What I Found
- Email campaign had strong open and click rates (45.7% open, 7.5% CTOR).
- Only 15/49 sessions landed on the intended page — highlighting a tracking issue.
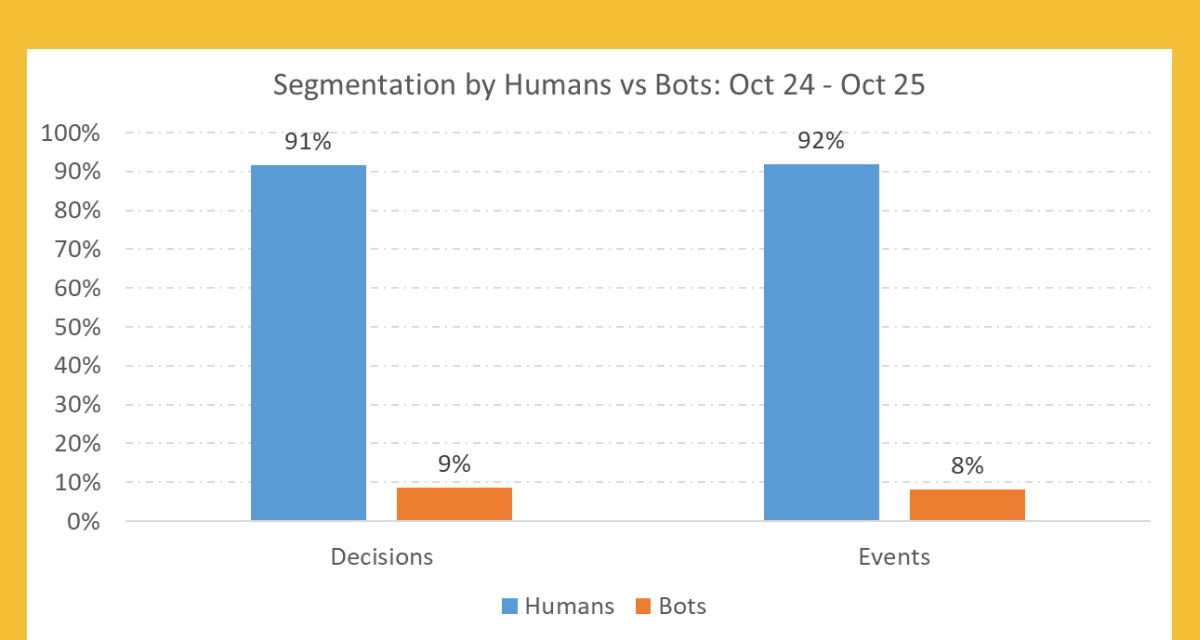
- Contentsquare revealed:
- Higher engagement at the top of the page (scroll heatmap)
- More focused journeys (62.5% continued to related content vs. 22.5%)
- Higher hover rates on personalised zones (42–68% vs. 10–14%)
What I Learned
- Personalisation worked — but only when users landed on the right page.
- Behavioural tools like Contentsquare are essential for validating UX hypotheses.
- Next time, I’d:
- Audit UTM links more thoroughly
- Test different layouts for mobile
- While session replays weren’t viable due to low volume, the hover and scroll data already suggested where CTA visibility could be improved.
📸 Visuals
On the left: users from the personalised campaign
On the right: users on the same page but outside the campaign audience
Journey Analysis
Journey analysis shows campaign users were more likely to continue exploring relevant content and less likely to exit.

Heatmap (Scroll)
Scroll and hover data show that users focused on the top of the page where personalisation was applied — validating the design strategy.

Zoning Analysis (Hover Rate)
Campaign users had lower bounce, higher engagement, and better conversion.

Feedback welcome.
If you have thoughts on this approach or ideas for similar challenges, I’d love to connect.

Leave a Reply