
Project Title
MAU Investigation & Cost Optimisation – Oct 2024 → Oct 2025
Introduction
In September–October 2025, I led a critical initiative to reconcile Optimizely’s Monthly Active Users (MAUs) against our analytics reality. Optimizely bills on MAUs, so accuracy directly impacts cost optimisation and data integrity.
This case study outlines how we queried raw experimentation data (E3 export), built a BigQuery analysis pipeline, and quantified the bot‑driven inflation behind our MAU overage — then framed next steps for engineering and commercial teams.
The Challenge
Throughout 2025, we observed that Optimizely’s MAUs were materially higher than GA4 active users. Support collaborated with us to investigate potential bot presence (e.g., PetalBot, Google Read Aloud), but the initial CSVs provided by Support were aggregated and non‑deduplicated, making it hard to translate activations into unique, billable user counts.
With renewal approaching and an allowance of 35,000,000 MAUs, we needed to prove where the discrepancy came from and whether it was human usage or bots.
What was at stake?
- Cost optimisation: Avoid paying for bots triggering experiments.
- Data integrity: Ensure experimentation metrics reflect real users.
- Stakeholder confidence: Establish a repeatable, defensible methodology for MAU verification.
My Role
As Product Owner – Optimisation, I:
- Orchestrated the investigation across Support, Data, and Web Delivery.
- Designed the data pipeline in BigQuery using Optimizely’s E3 export.
- Led the deduplication and bot identification analysis combining Decisions and Events.
- Synthesised findings into a stakeholder‑ready narrative and next steps (technical and contractual).
Tools & Setup
Platforms & Services
- Optimizely Experimentation – Events Export (E3): Source of raw Decisions & Events.
- Google Cloud Platform (GCP): For data processing and storage.
- BigQuery: Analytical engine for MAU reconciliation and bot segmentation.
- Python: For ingestion, batching, and schema validation.
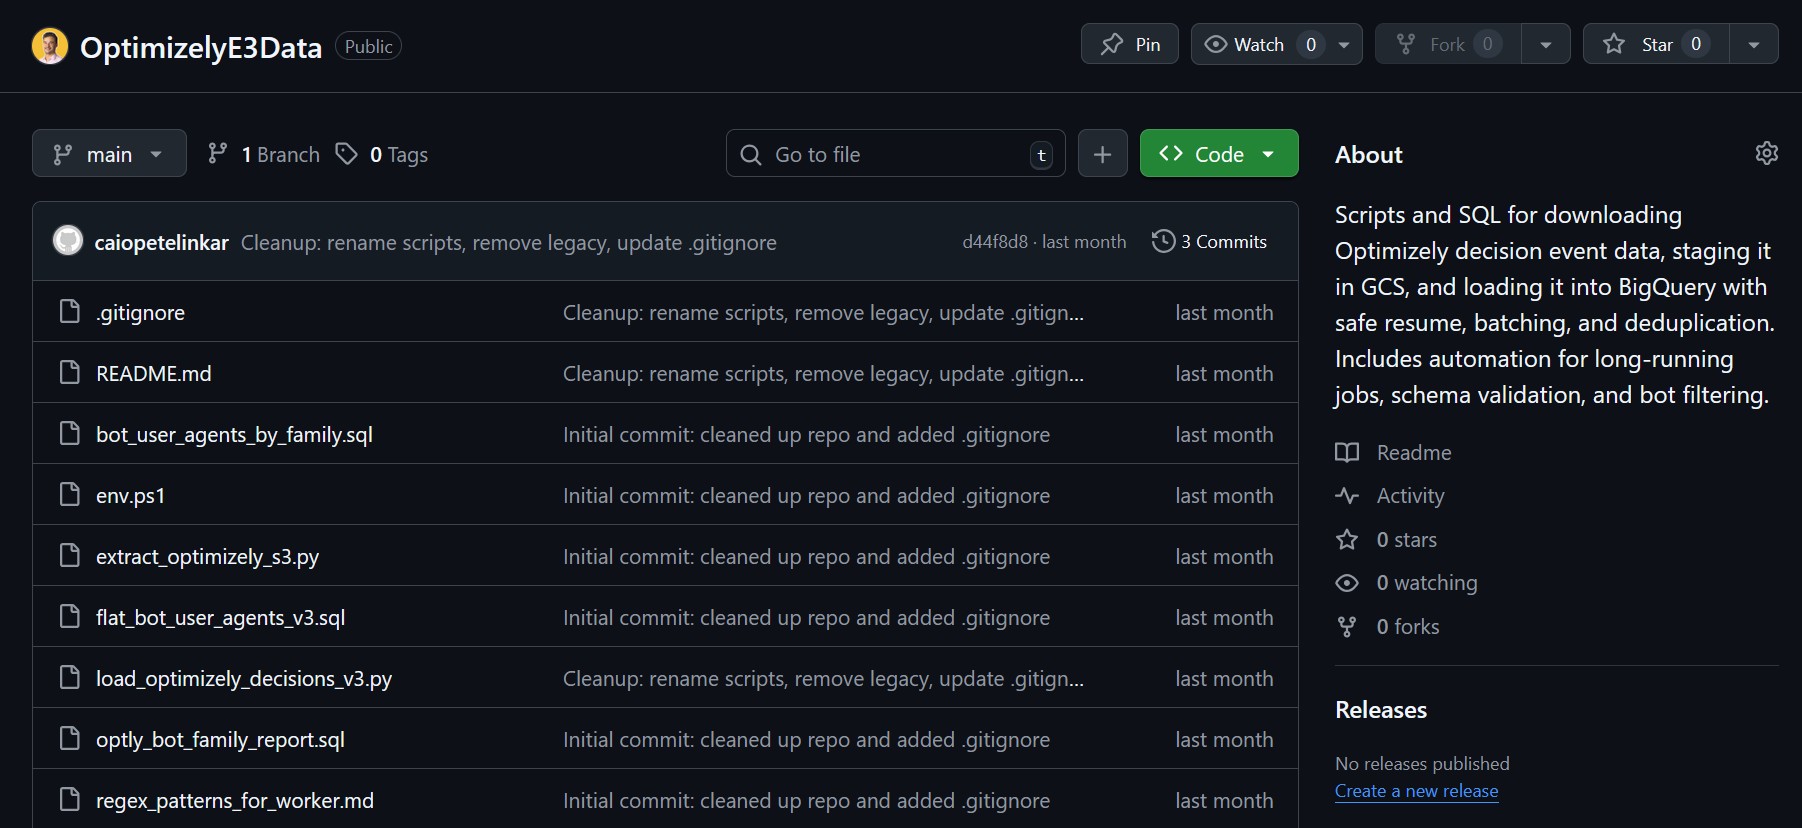
Repository
I created a step‑by‑step GitHub repo for anyone wanting to replicate this process:
👉 OptimizelyE3DataAbout
Includes scripts and SQL for downloading Optimizely decision event data, staging in GCS, and loading into BigQuery with safe resume, batching, and deduplication. Also covers automation for long‑running jobs, schema validation, and bot filtering.
Environment & Authentication
- Created a GCP project, BigQuery dataset, and service account with appropriate roles for data ingestion and querying.
- Used local JSON key authentication for Python scripts (never uploaded to GCP).
- Installed required packages:
requests,pandas,google-cloud-bigquery.
What We Tested
We focused on two analytical threads:
- MAU Reconciliation
- Union MAUs across Decisions ∪ Events for the billing window Oct 30 2024 → Oct 29 2025.
- Compared our query result to the Optimizely Usage Dashboard to verify methodology and identify timing deltas.
- Bot Identification & Quantification
- Segmented by user agent, referrer, and environment (staging/QA, translation proxies).
- Deduplicated at the visitor level to translate activations into unique, billable MAUs.
- Classified top bot families contributing to inflated counts.
What I Found
MAU Summary
- Union MAUs (Decisions ∪ Events): 37,684,955 (query)
- Usage Dashboard: 37,721,701
- Δ ≈ 36,746 (expected due to data refresh; query ran ~2 days earlier on ~100 GB)
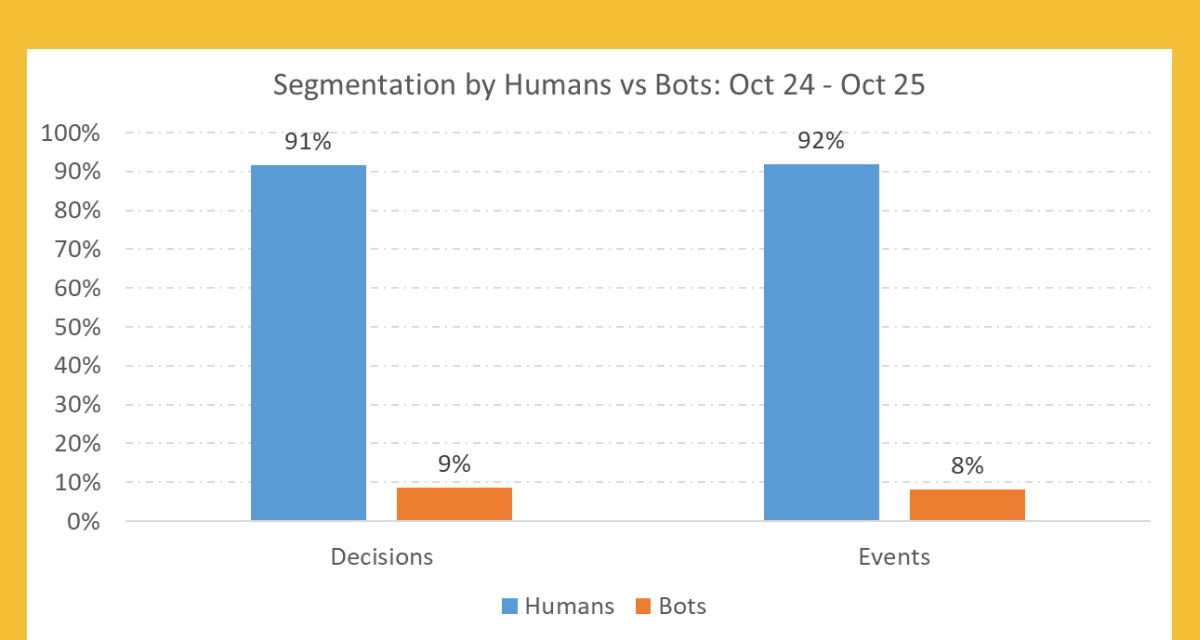
Segmentation by Bots vs. Humans
- Events MAUs: 37,683,901 → Bots: 2,994,299 | Humans: 34,689,602
- Decisions MAUs: 35,811,482 → Bots: 3,119,637 | Humans: 32,691,845
Interpretation:
If bot traffic were excluded, our human MAUs would be within the 35M allowance. The observed overage is primarily bot‑driven.
Top Bot Families Identified
| Bot Family | Visitor‑Months Impacted | Distinct Visitors | Rows Flagged |
|---|---|---|---|
| PetalBot | 2,310,941 | 2,310,936 | 20,822,666 |
| HeadlessChrome | 633,162 | 633,156 | 6,913,528 |
| Google Translation/Proxy | 160,589 | 159,179 | 1,077,587 |
| Other Bot (Generic) | 107,849 | 107,846 | 1,130,645 |
| Google Read Aloud | 38,800 | 38,800 | 164,642 |
What I Learned
What worked well
- Direct access to raw E3 data enabled defensible reconciliation and segmentation.
- Union of Decisions ∪ Events reduced blind spots and supported cross‑validation with the dashboard.
- Visitor‑level deduplication was essential to convert volume into billable MAUs.
What we decided
- Treat the overage as bot‑driven rather than human usage.
- Proceed to technical mitigation (Cloudflare Workers and/or Optimizely Disable API) to prevent bot‑triggered MAUs going forward.
- Maintain a repeatable query suite to monitor MAUs and bot contribution monthly.
What I’d do differently
- Establish a bot‑monitoring guardrail earlier (e.g., monthly bot breakdown by UA/IP/referrer) with alerts when bot‑related MAUs exceed thresholds.
- Formalise staging/QA filtering to ensure experimentation scripts never run in non‑production contexts.
Surprises
- The IAB/ABC list (used by Optimizely’s default filtering) doesn’t capture several impactful bot families; friendly/self‑reported bots are covered, but headless/custom crawlers can slip through.
- HeadlessChrome contributed materially and needed custom handling beyond default filters.
Feature Suggestion
An optional customer-managed blocklist (user agents/IP ranges) inside Optimizely’s Admin dashboard could complement IAB/ABC and improve fairness in MAU billing.
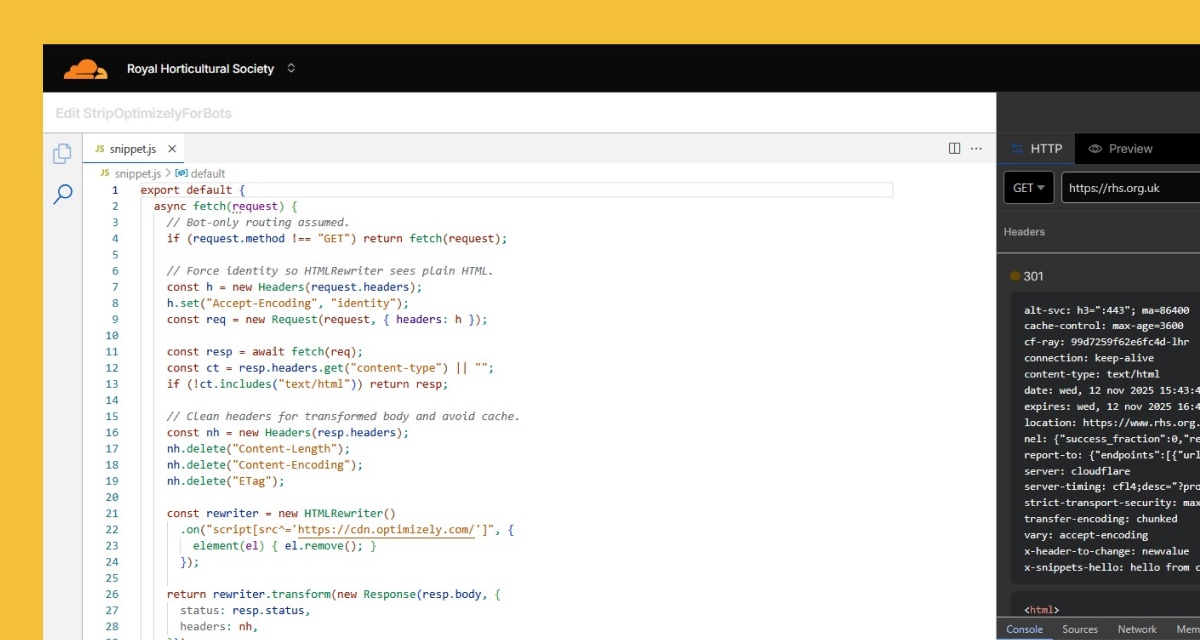
Next Steps
- Edge‑side mitigation: Implement Cloudflare Workers to conditionally remove the Optimizely snippet for known bot UAs/IPs before any MAU‑impacting calls.
- Client‑side fallback: Use Optimizely Disable API in Project JS for headless/browser‑detectable bots.
- Ongoing monitoring: Automate monthly bot breakdowns and alerting; track delta vs. dashboard after mitigation.
- Explore other platforms with user-based billing: We’re already assessing whether similar inflation exists in other tools we use, such as Google Analytics 360, which also operates on a usage-based model. This could uncover additional cost optimization opportunities and improve data integrity across our analytics stack.
Visuals
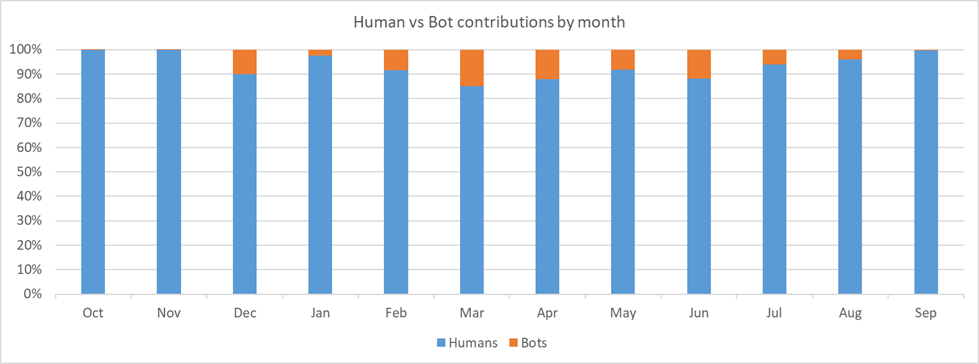
Human vs Bot contributions by month
Top user‑agent families by visitor‑months
| bot_family | visitor_months_impacted |
| petalbot | 2,310,941 |
| headlesschrome | 633,162 |
| google-translation/proxy | 160,589 |
| other-bot-generic | 107,849 |
| google-read-aloud | 38,800 |
Step-by-Step Guide: Optimizely E3 Data Analysis with BigQuery & Python
Feedback
Do any of your platforms have a user-based billing model that might be inflated by bot traffic? If so, how are you detecting and mitigating it? I’d love to hear your approach
Views are my own and shared to help teams improve experimentation data integrity and cost efficiency.


Leave a Reply